Institutional Insights: Goldman Sachs SP500 Key Levels & Positioning 9/12/25

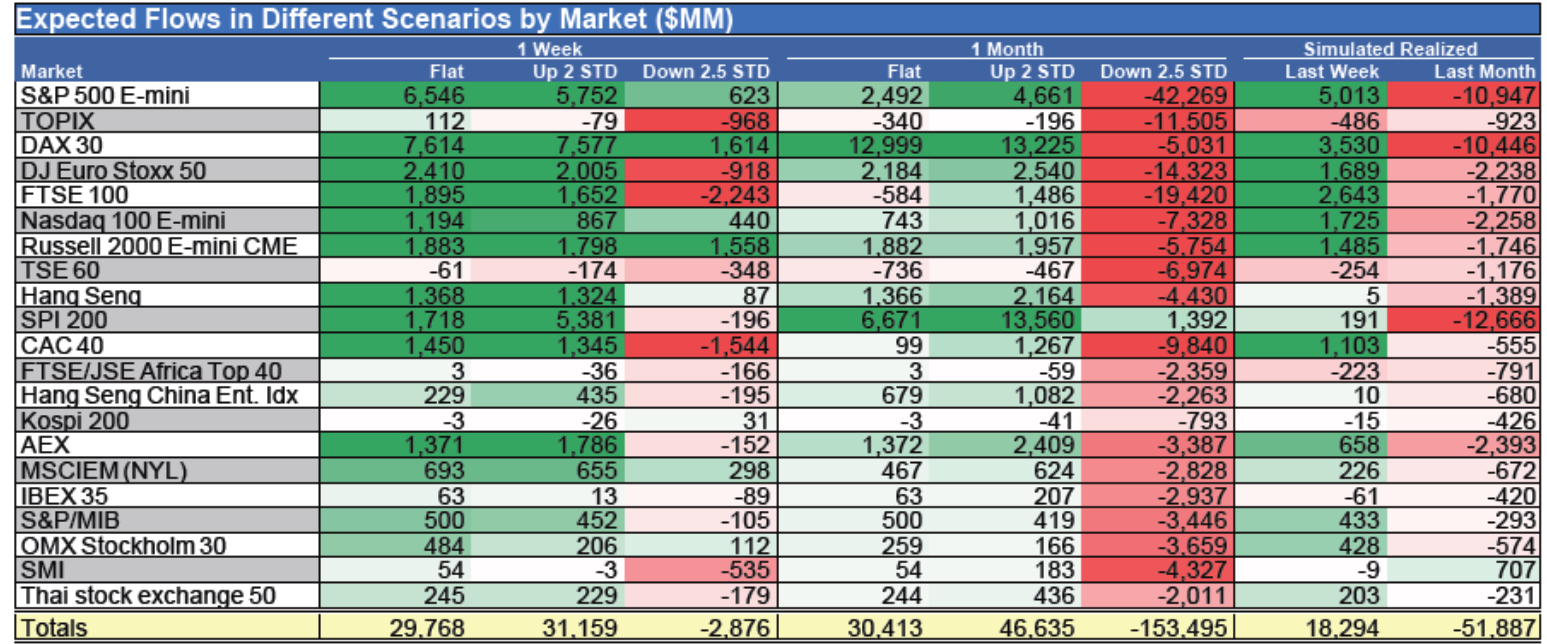
CTA Down Tape Outflows: $153.5B in 1-month down tape (compared to $2.88B in 1-week) indicates a significant exit from the US market; SPX faces critical support at 6754, with a break below 6512 signaling a high risk of volatility.
SPX Technicals & CTA Divergence: Immediate support for SPX is at 6754, with medium-term support at 6512; there’s a divergence in CTA strategies marked by sharp declines in GS CTA estimates for December 2025 and a 4.25% spike in 1-month volatility, reflecting increased market stress and poor trend-following performance.
Gamma Volatility Risk: The highest gamma (6.5k $mm) occurs with a 1% SPX spot move; negative gamma below -5% spot moves complicates and raises the cost of hedging during volatile periods, necessitating dynamic adjustments.
Prime Brokerage Leverage & Flows: Gross leverage increased by 1.5 points to 286.6% (73rd percentile), while net leverage rose by 0.4 points to 81.2% (99th percentile); the Materials sector has reported its first net sell in 11 weeks (L/S ratio 1.9), indicating a sector rotation and heightened long positioning.
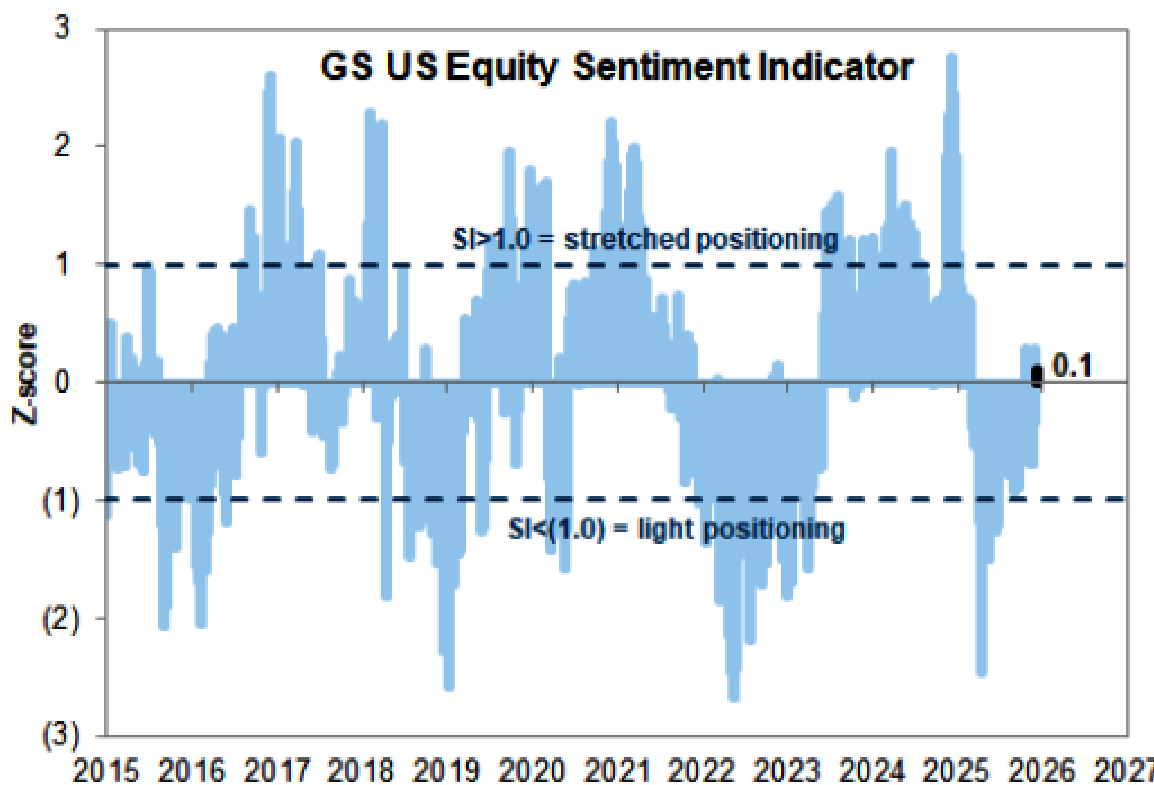
Systematic Macro Exposure: Systematic macro strategies maintain approximately $500 billion in global equity exposure (an increase since 2020); US equity systematic positioning (including CTAs, Risk Parity, and Volatility Control) displays a consistent upward trend since 2020, which requires monitoring for overextension risks.
Disclaimer: The material provided is for information purposes only and should not be considered as investment advice. The views, information, or opinions expressed in the text belong solely to the author, and not to the author’s employer, organization, committee or other group or individual or company.
Past performance is not indicative of future results.
High Risk Warning: CFDs are complex instruments and come with a high risk of losing money rapidly due to leverage. 71% and 74% of retail investor accounts lose money when trading CFDs with Tickmill UK Ltd and Tickmill Europe Ltd respectively. You should consider whether you understand how CFDs work and whether you can afford to take the high risk of losing your money.
Futures and Options: Trading futures and options on margin carries a high degree of risk and may result in losses exceeding your initial investment. These products are not suitable for all investors. Ensure you fully understand the risks and take appropriate care to manage your risk.
Patrick has been involved in the financial markets for well over a decade as a self-educated professional trader and money manager. Flitting between the roles of market commentator, analyst and mentor, Patrick has improved the technical skills and psychological stance of literally hundreds of traders – coaching them to become savvy market operators!